On the surface, California’s latest Allergen Disclosure for Dining Experiences Act, which took effect in July, was supposed to be about food allergies. However, recent data from the San Francisco-based ingredient-transparency platform EveryBite revealed that legislative change helped usher in a broader shift in how Americans order food, even among consumers without specific ingredient restrictions.
The nation’s most populous state passed Senate Bill 68 in late 2025, which now requires restaurant brands operating 20 or more total locations [with at least one unit in California] to disclose the top nine major allergens for every standard menu item across digital and physical ordering channels.
Menu intelligence tools, such as EveryBite, leverage artificial intelligence to help operators meet the new legislative requirements. EveryBite, specifically, uses a SmartMenu tool that pulls ingredient-level data to help guests make educated ordering decisions.
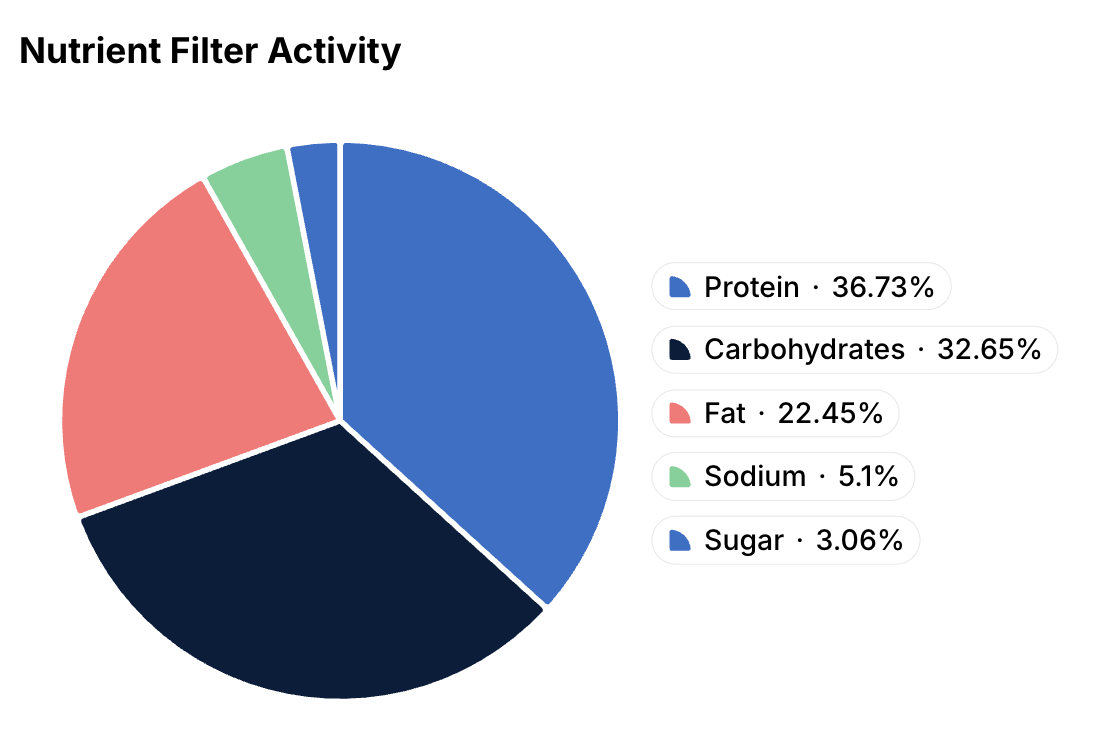
Internal data from menu intelligence platform EveryBite found protien as the most used nutrition filter for the company’s SmartMenu ingredient transparency tool.
According to data from EveryBite’s 2026 mid-year personalized menu report, which drew on more than 12 million menu interactions from more than 1 million unique guests, protein emerged as a leading purchase signal, reflecting broader health- and GLP-1-driven dining trends.
Restaurant nutrition postings have long centered around restrictions, but EveryBite’s July 1 report found that protein claimed the title as the most searched nutrient category—used 10 times more frequently than sugar filters. The SmartMenu data revealed that GLP-1 users visit restaurants 7.6 times per week, about 2.5 visits higher than consumers not using the category of weight-loss drugs, and that protein is their primary search.
Additionally, while operators may view allergen transparency as a tedious and potentially costly regulatory hurdle, EveryBite’s internal data showed that menu intelligence platforms can serve as a critical tool for acquiring guests from a particularly loyal, allergen-conscious demographic.
In fact, the number of ingredient filters a guest uses when preparing an order directly correlates with conversion rates: The more a customer personalizes menu items, the more likely they are to order, according to the SmartMenu report. Users applying one filter had a 17.5 percent conversion rate; those applying three filters achieved a 38.2 percent rate; and those applying 11 or more filters achieved a 79.1 percent conversion rate.
According to findings from the Nutritics 2026 Allergy Dining Report, unclear allergen information risks $78 in table spend every time an allergy-affected guest chooses another restaurant, creating a $12.6 billion blind spot for restaurant owners and operators.
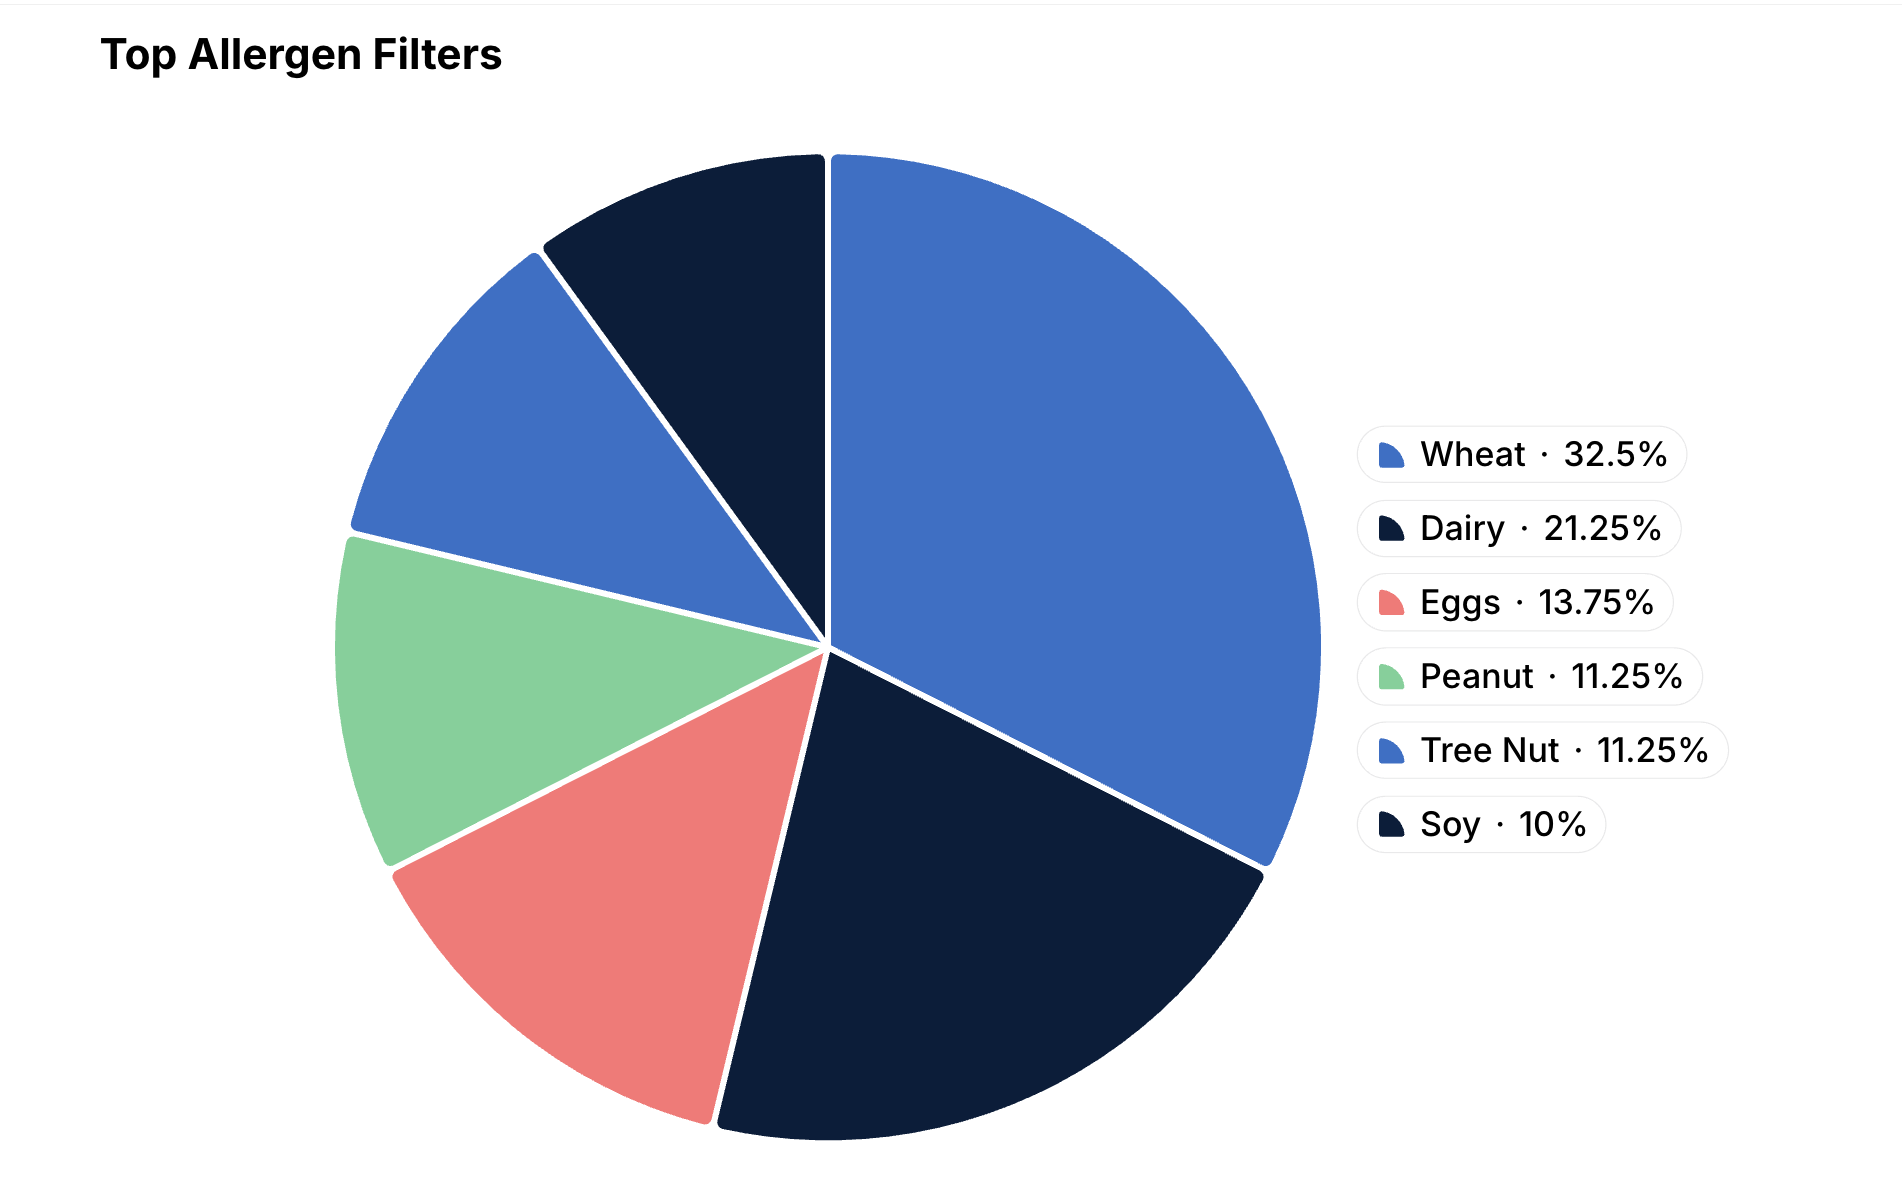
Wheat, dairy and eggs, in that order, were the top three allergen filters used by EveryBite SmartMenu ingredient transparency tool, according to a 2026 mid-year report from the company.
The U.S. represents the largest food allergy market in a global sector valued at $44.76 billion last year and projected to grow 6.88 percent annually to about $81.5 billion by 2034, according to 2026 industry analysis published in June by Fortune Business Insights. Spurred by rising food allergy prevalence and advanced diagnostic services, the North America market accounted for 41 percent of total global revenue in 2025.
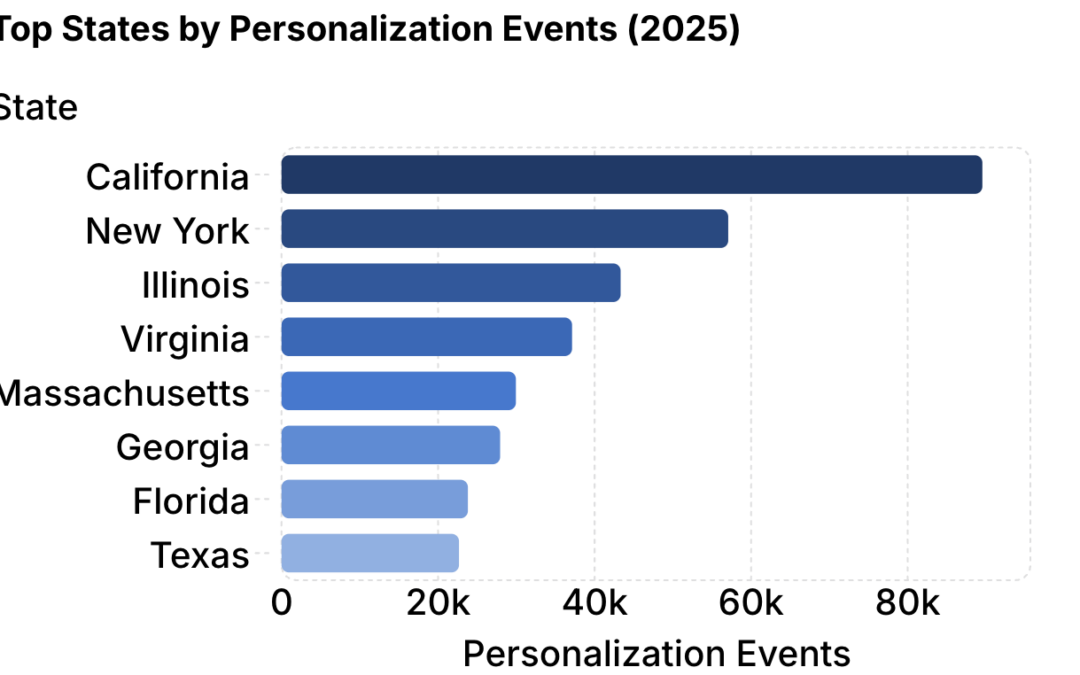
Lastly, EveryBite’s mid-year data reflected that menu intelligence tools for personalization represent a national behavioral shift, not limited to densely populated coastal communities. Although the highest visitor concentrations last year came from markets like New York, Chicago, Los Angeles and Atlanta, 2026 heat maps show significant activity around Texas metro regions and Midwest hubs, alongside coastal staples like Southern California, Florida and the Northeast corridor.