In a recent survey, consumers showed their varying preferences for how they utilize restaurants, delivery and digital ordering.
The survey, from data and analytics firm PYMNTS, with Paytronix as a surveying partner, asked more than 1,100 consumers across the country what they ordered, how they ordered and what their priorities were in food and dining. Part of an ongoing series titled “Digital Divide,” the survey found some interesting differences across the country. The insights may provide some directional suggestions for restaurants trying to enhance their ongoing digital strategies.
There were some minor differences in the types of restaurants consumers prefer to visit. Consumers in the South and the Mountain region preferred getting food from QSR restaurants versus table service. Consumers in the Northeast and South Atlantic regions preferred table-service restaurants.
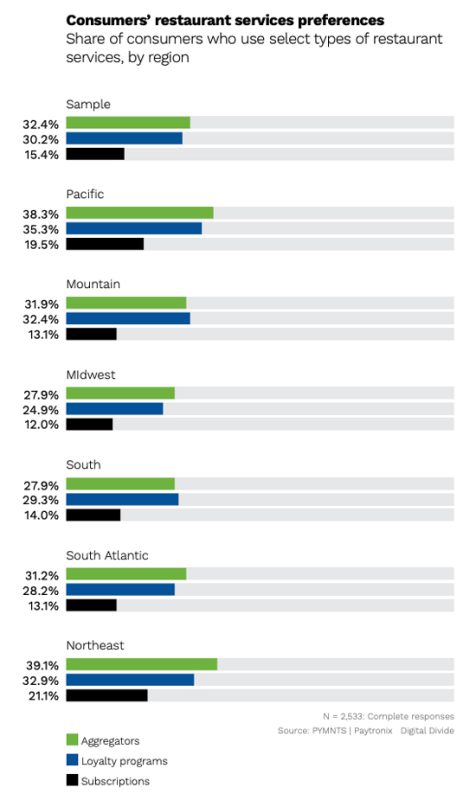
 There were larger differences in the services they utilized. Respondents were asked if they preferred third-party aggregators, loyalty programs or subscriptions. Consumers in the Pacific region, consisting of California, Oregon, Washington and Alaska, had the highest preference for loyalty programs, with 35.3 percent of them saying it was a preferred service. The lowest preference for loyalty was in the Midwest region, with 24.9 percent of respondents saying they preferred loyalty at their restaurants.
The Northeast preferred aggregators most strongly. In all, 39.1 percent of respondents preferred the service, followed closely by the Pacific region with 38.3 percent of respondents. The Northeast also had the strongest preference for subscription services, at 21.1 percent; the Midwest had the least preference for subscriptions—just 12 percent of respondents said they preferred subscriptions.
The preferences are a good indicator of what restaurant operators should focus on in their respective regions. An operator in the Northeast may want to hone their strategy when it comes to third-parry aggregators and make sure they have a great process in place. Operators on the West Coast may want to think about a good loyalty program to stand out from the crowd.
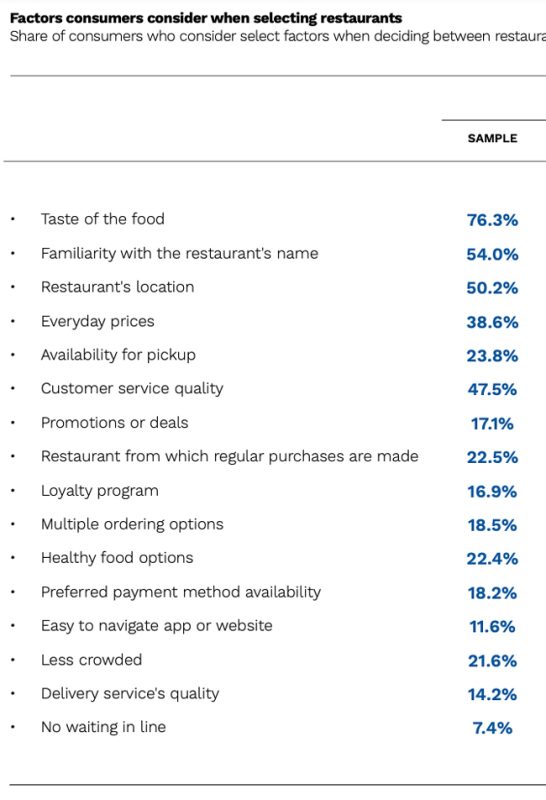
The survey also highlights what factors consumers consider when selecting restaurants, and it’s a wider spread of considerations between the regions. The hallmarks are obvious. Taste of food is the No. 1 consideration across table service and QSR; 76.3 percent of respondents said it was a factor for table-service restaurants, 73.4 said it was a factor for QSR.
Respondents on the West Coast rank familiarity with the restaurant’s name the lowest among any region for table service; just 48.3 percent of people said that was a factor. That may be fertile ground for all those fun and silly virtual restaurant or ghost kitchen names. The same goes for the Northeast when it comes to QSR. Just 47 percent of respondents said knowing the name was a factor in their consideration.
Pickup availability was a big consideration in the Northeast, as 28.4 percent of respondents said it was a factor, 5 percent more than the average. In the Midwest, 34.3 percent of respondents said it was a factor in their QSR decisions, notably higher than the 30 percent average across the country. 
Quality of delivery service was vastly more important on the West Coast, or Pacific region, as well as the Northeast. Respectively, 20.6 percent and 24.2 percent of respondents said it was a key consideration. Both regions stated that as a factor far higher than the 14.2 percent average for the table-service segment. It was less of a factor among QSR nationally, though both the East Coast and West Coast factored that higher for quick-service restaurants.
One factor that was interestingly not a big deal across the country: multiple ordering options. Across the U.S., just 18.5 percent of respondents said it was an important factor. Assuming the consumer has their preferred mode of ordering, it seemed like additional options didn’t matter all that much.
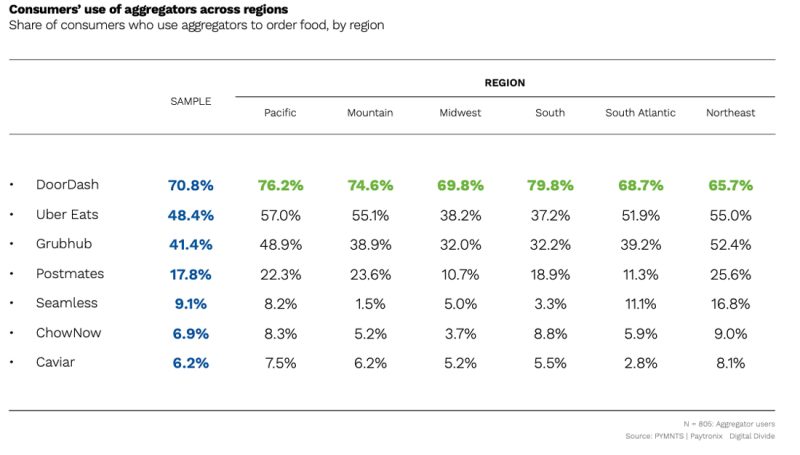
Finally, the survey asked respondents which third-party aggregator they used. DoorDash was by far the most used across the country, as 70.8 percent of respondents said they used the service. That makes sense as it remains the dominant aggregator across the country. It was followed by Uber Eats, at a distant second with 48.4 percent.
A look at regional differences in the aggregator usage showed the following: The South uses DoorDash more than average, the Pacific region uses Uber Eats the more than average and the Northeast uses Grubhub more than average. Postmates, interestingly enough, didn’t have outsized usage on the West Coast, where it had such a following, especially in Los Angeles. Respondents in the Northeast actually used it much more than the average.

While the survey validates what a lot of operators probably see in their markets, it’s a useful look at how consumers are thinking about restaurants and especially off-premises channels. Head over to PYMNTS to get the full survey.


